Viewing statistics
Statistics appear in two places:- In the editor, below the workspace. Statistics in the right sidebar jumps there.
- On the project’s viewer page, at the bottom.
Your own visits, and visits by members of your organization, are not counted, so the numbers reflect your audience.
What is measured
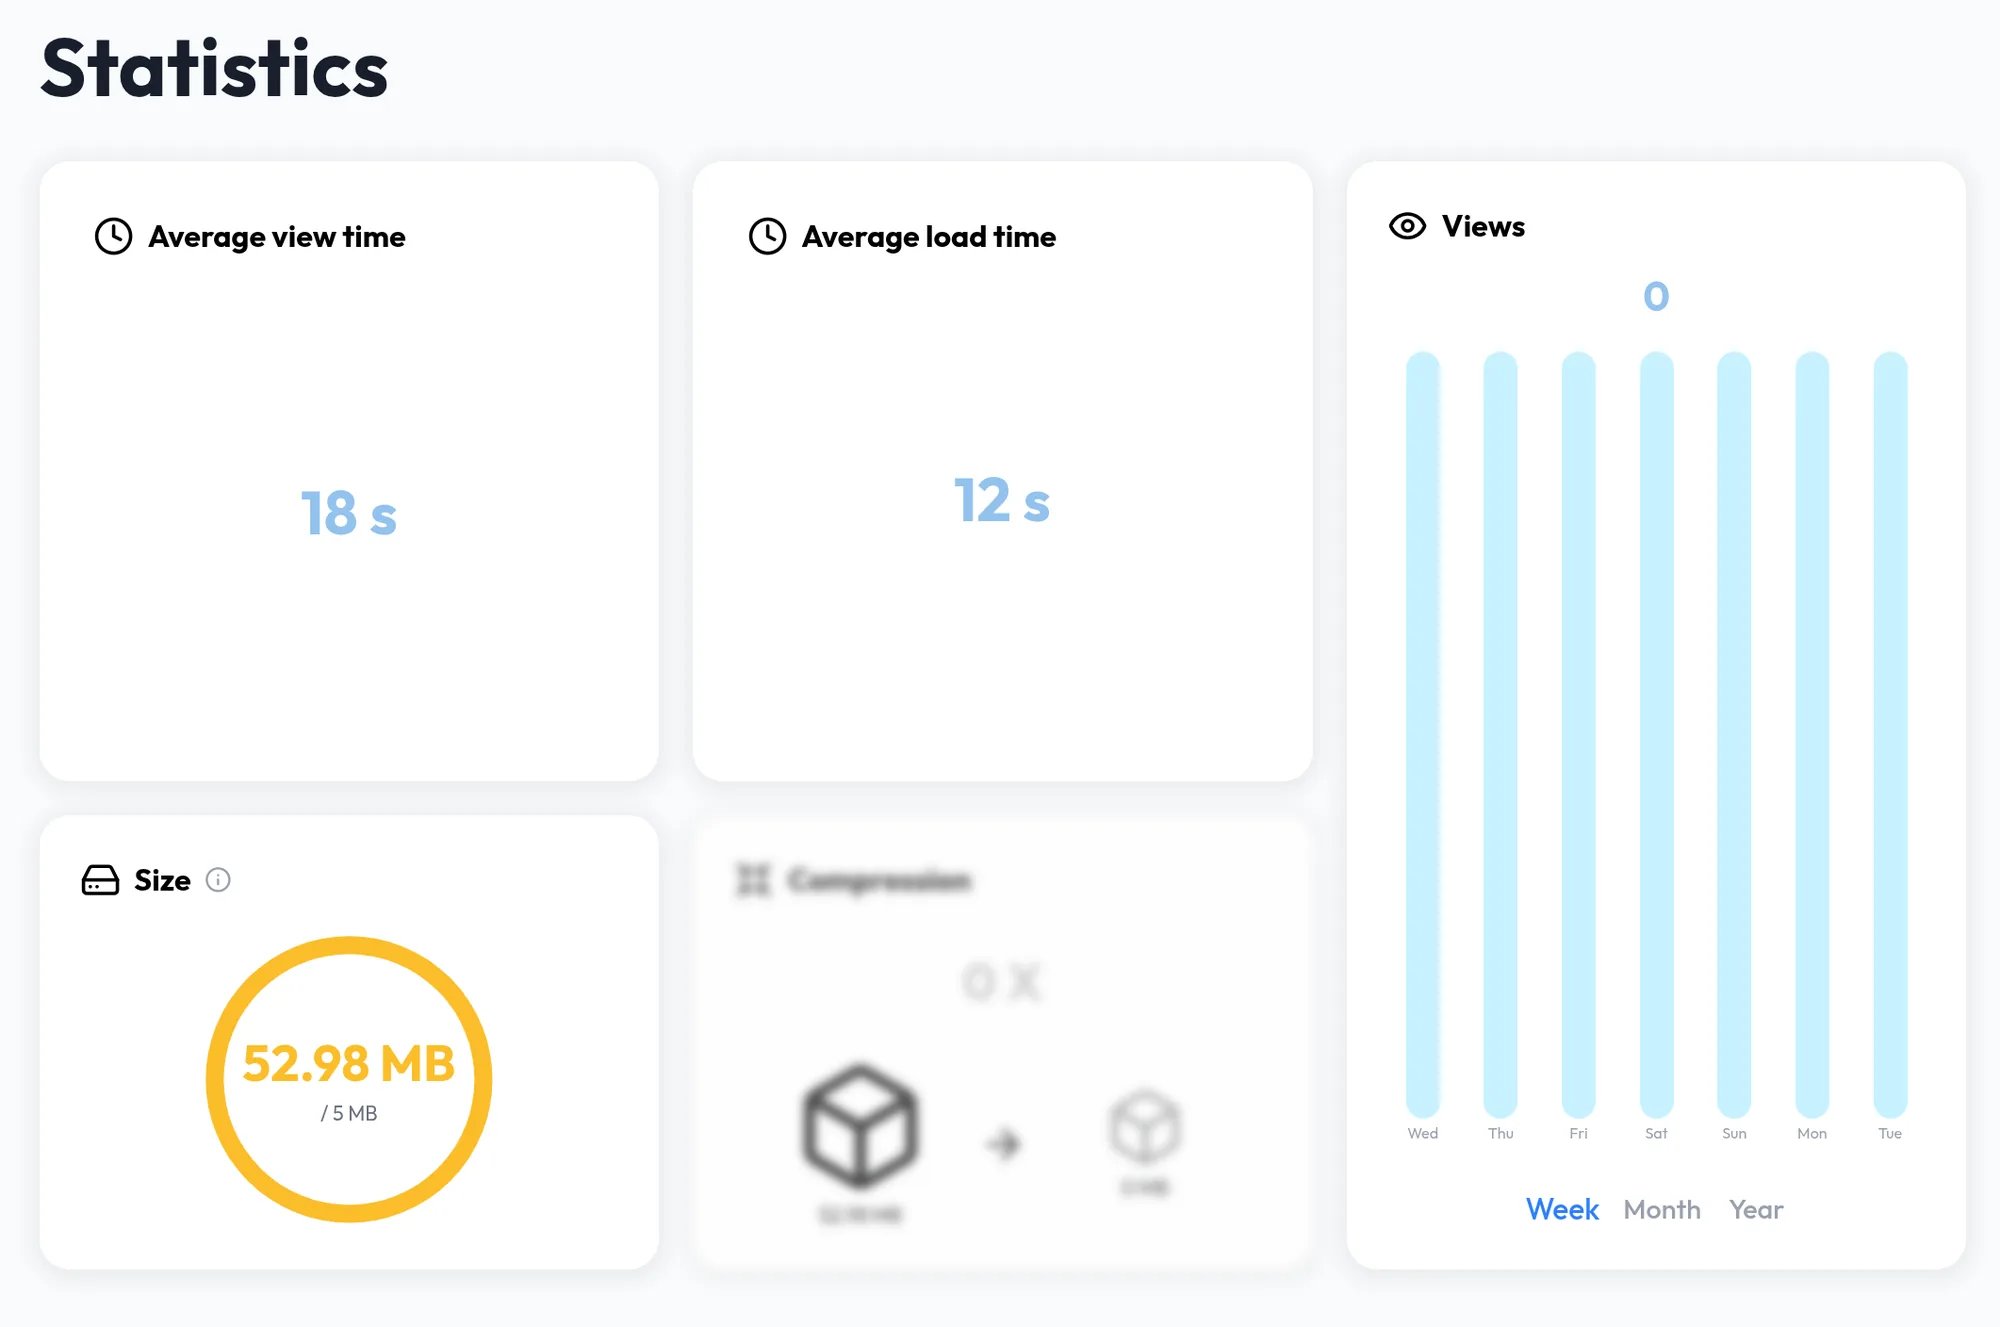
Models show these cards:
Views can be shown by Week, Month, or Year. On the Size card, green means good for mobile, yellow may cause performance issues, and red is not recommended.
Walkthroughs show Average view time, Views, and the number of rooms.
Comments
Every published project has a Comments section on its viewer page. Visitors must be signed in to comment, and comments can be up to 2000 characters. You can edit and delete your own comments, and the project owner can delete any comment on it. Only people who can open the project can read its comments.
Likes
Signed-in visitors can like a project with the heart on its viewer page. Likes feed the Popularity sort in the library.Notifications
The bell in the top bar tells you when an AI job completes or fails, with tokens refunded on failure, and when your subscription expires in less than 3 days.